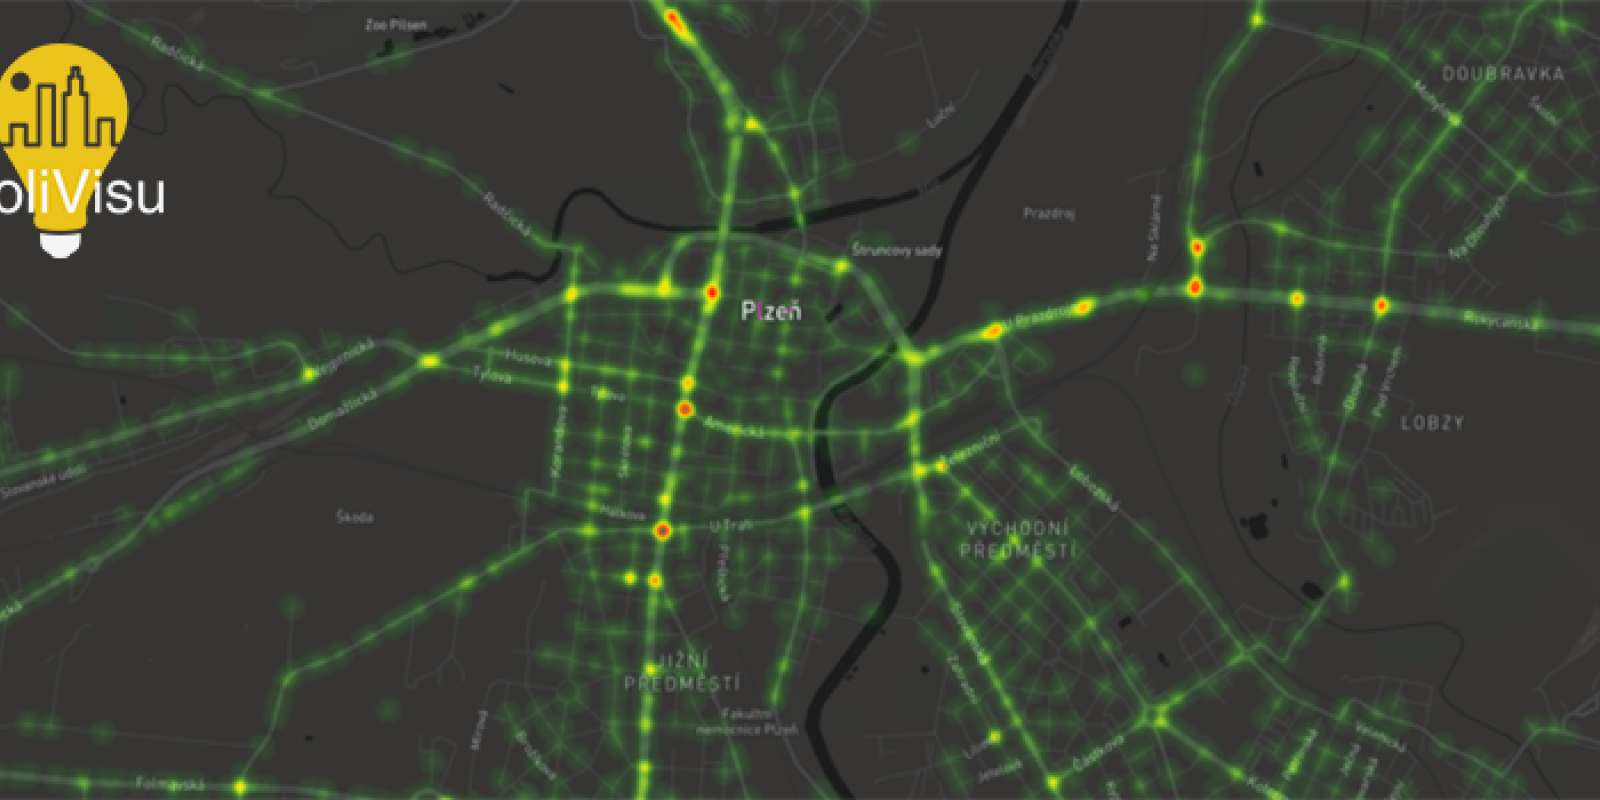
Better policy making through data and visualisations


This free online course is developed by the European project PoliVisu to promote the use of advanced visualisations in policy making. Focusing on urban mobility as an important subfield within transportation, the course provides a holistic view of data visualisations and their role at different stages of the policy process. The course draws on multiple disciplines, learning formats and best practices to offer content that is both engaging and insightful for a wide range of audiences.
Who is this course for?
This course is open to everyone. That said, people who would find it especially useful are
- Public sector staff who either work with data directly (analysts, data officers etc.) or depend on it to make informed decisions e.g. department managers, councilors, mayors, CEOs, elected officials, social scientists, journalists and civil society groups interested in exploring social issues through data visualisations University students studying towards a degree in transport, urban mobility, data science or related fields GIS specialists, traffic engineers, web developers and Open Source enthusiasts.
How is this course organised?
The course is published all-at-once, meaning there will be no gradual releases over time. Learners are encouraged to follow the course at their own pace, taking as much time as they need. Individuals who complete all the required assignments will receive a free 'Statement of Participation' at the end.
The course is organised around three main modules preceded by an introduction. Each module is made up of three chapters and ends with a quiz.
Learners must view all pages and attempt all activities (forums, quizzes) in order to achieve 100% completion, at which point the certificate will be sent to their email.
Access to the course here.


